Monitoring with Pynmon
Reference for Pynmon, the built-in web monitoring interface for Pynenc.
Why Pynmon?
Setting up a distributed task system is the easy part — even easier with Pynenc. The hard part is understanding what happened when things go wrong. Which task called which? Where did it run? Why is it stuck? Pynmon gives you deep, real-time visibility into your distributed execution without any external tooling.
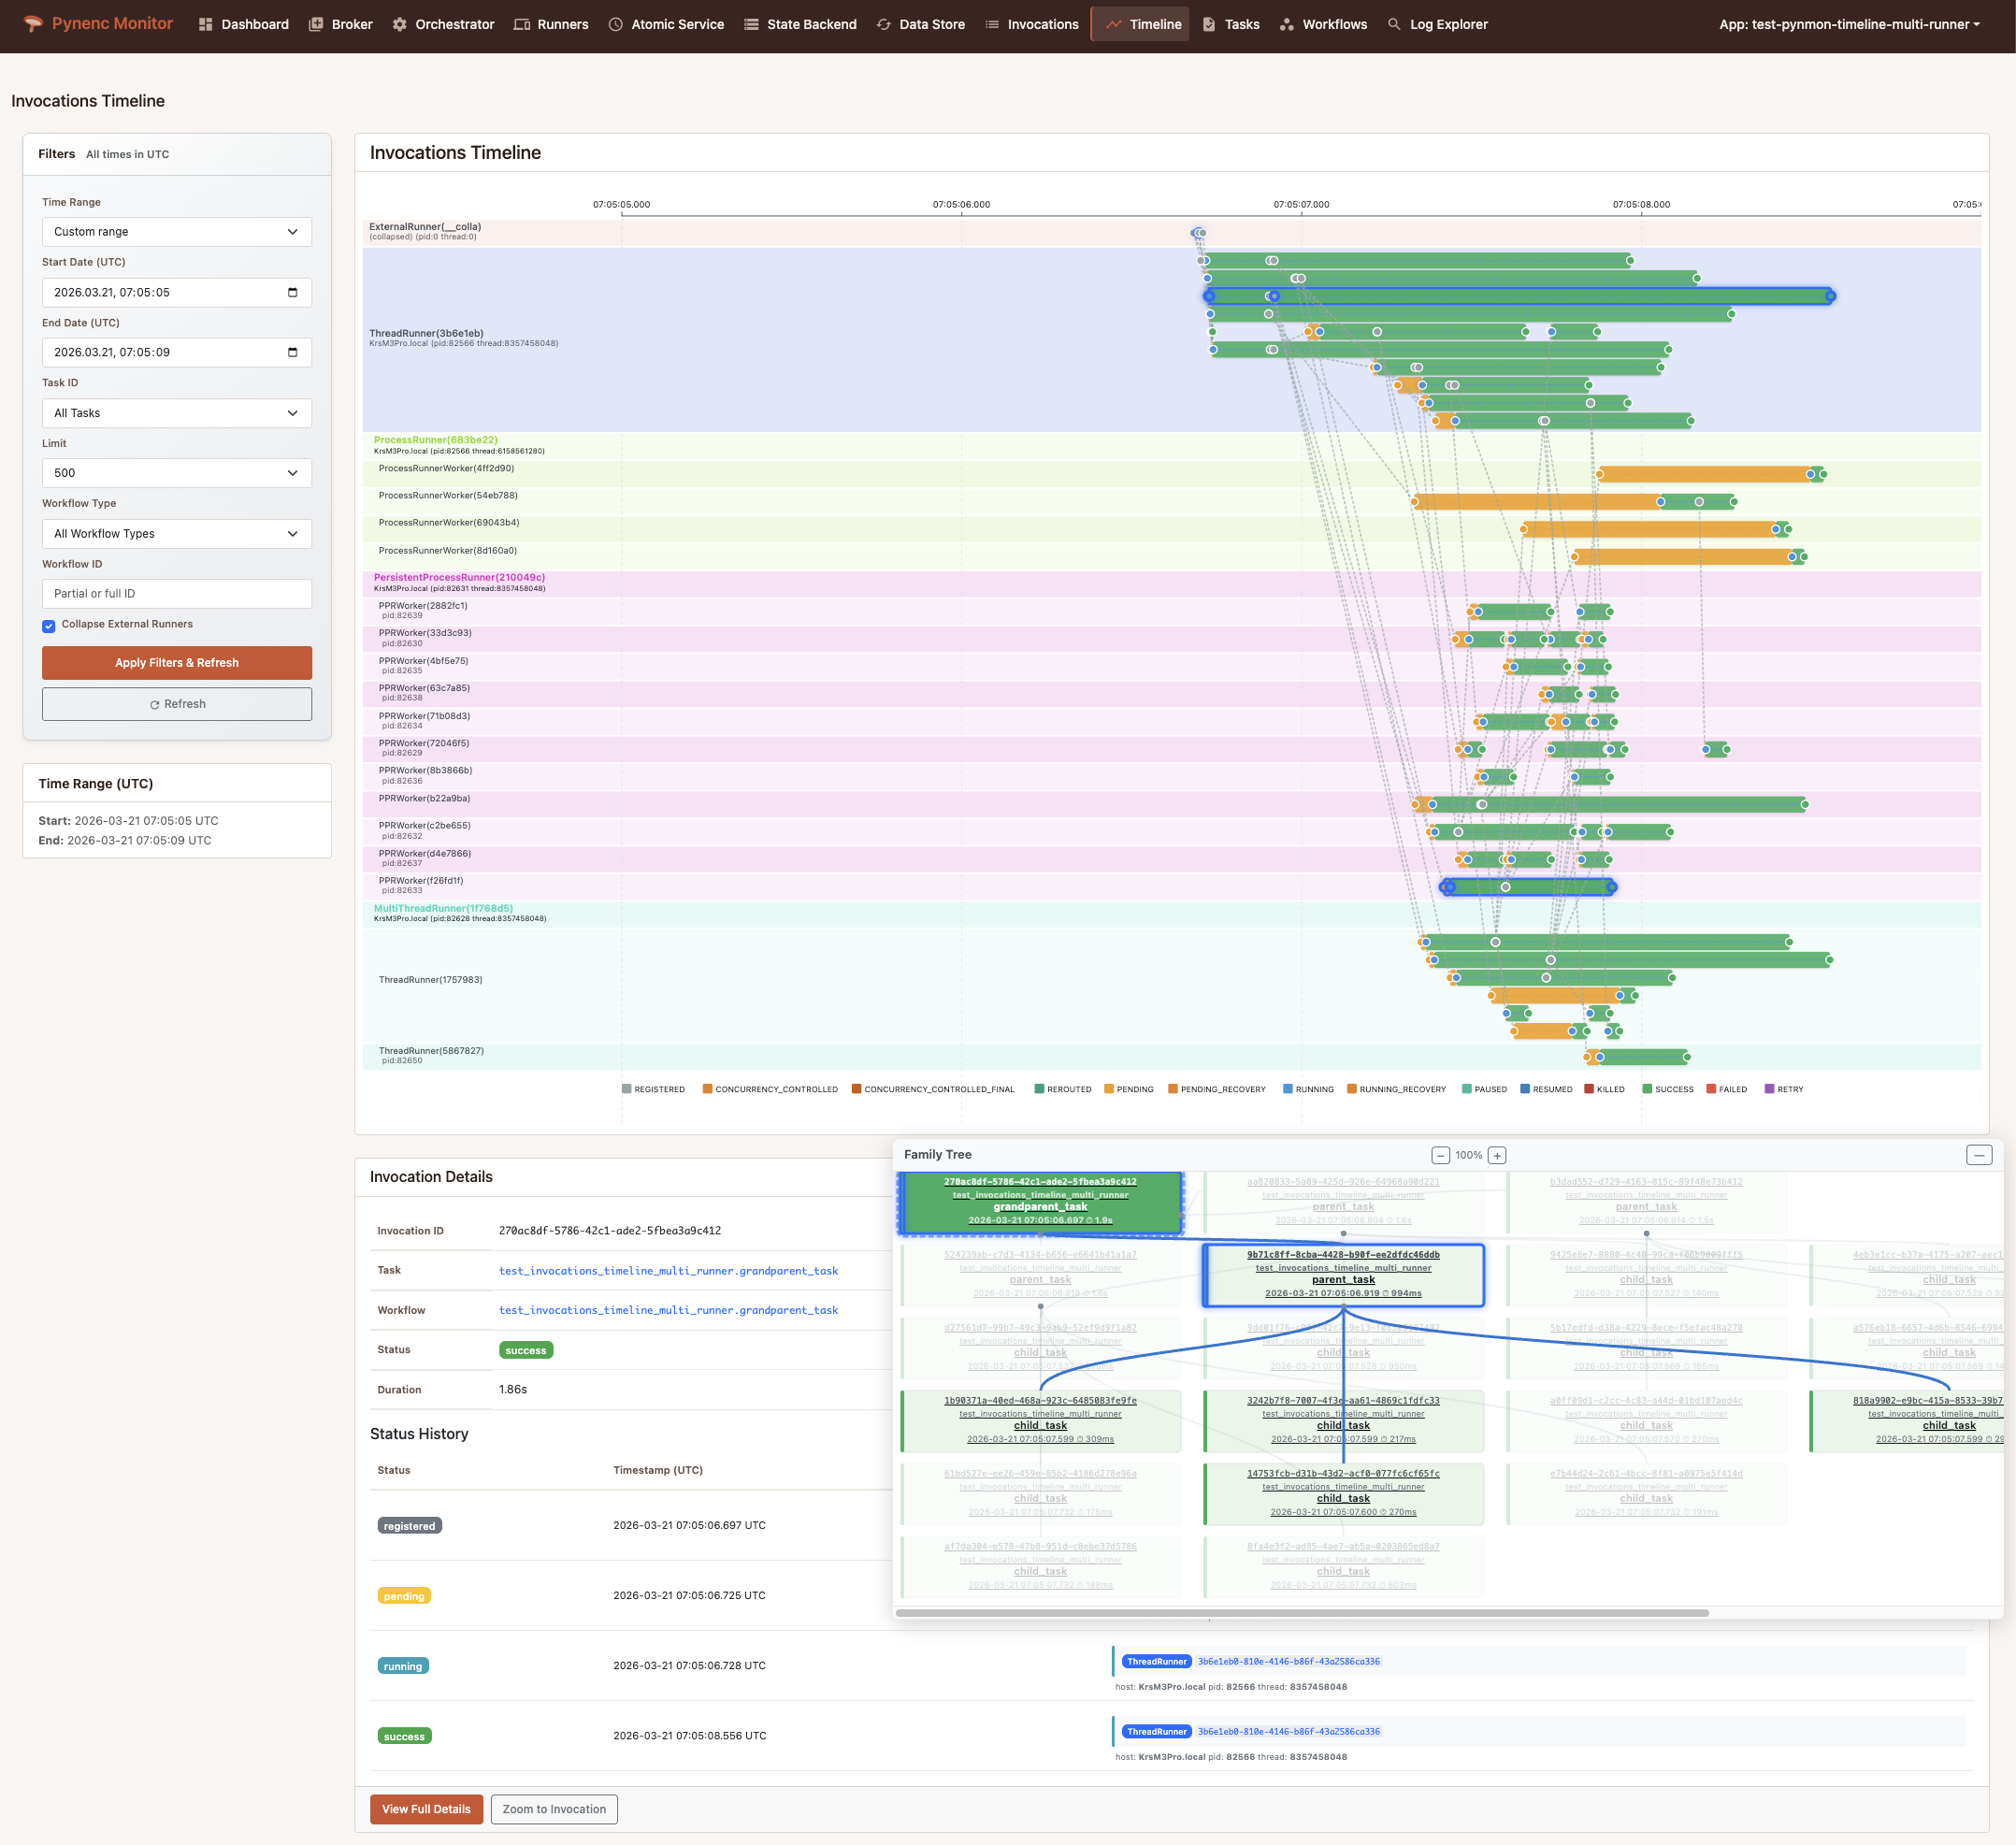
Execution Timeline
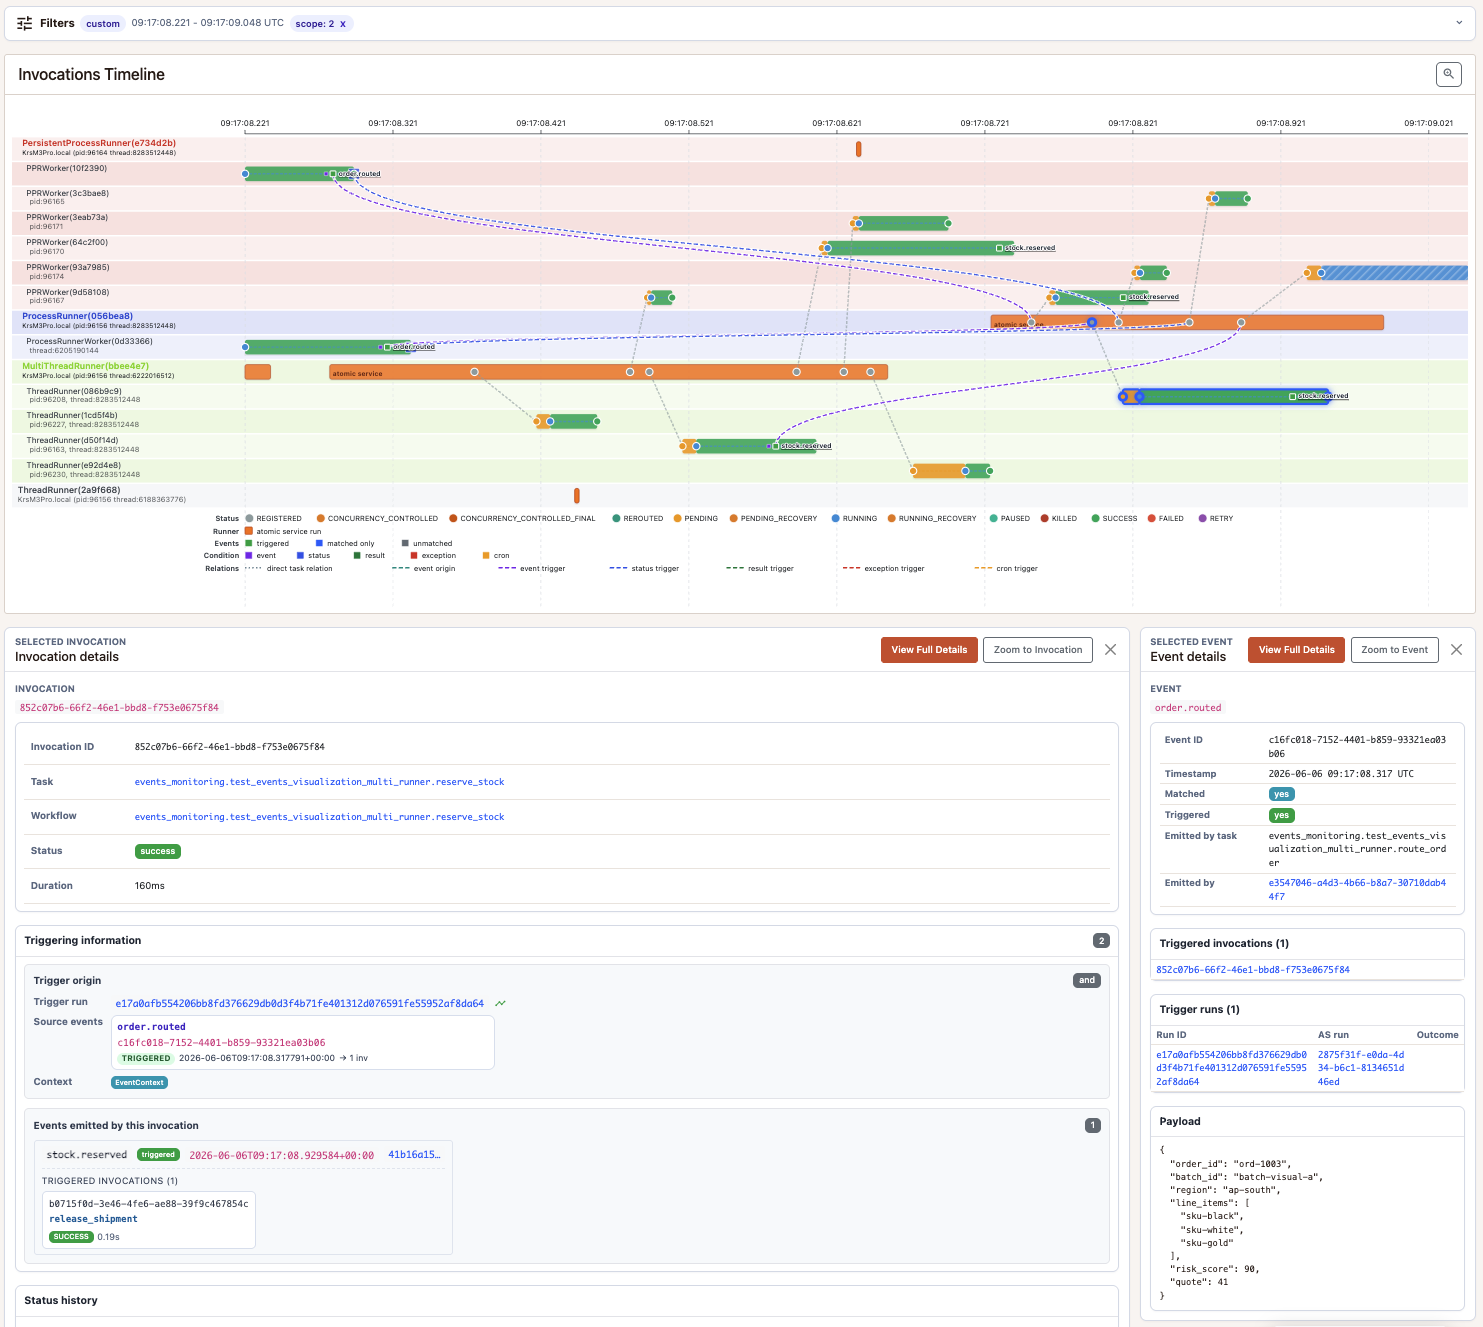
See exactly what ran across every runner and worker, at every moment. Status transitions are color-coded — orange for pending, green for completed, blue for running — with connections between parent and child invocations. Click any invocation to inspect its full status history and the runner context that executed it.
Trigger activity is drawn on the same timeline. Event markers sit in a dedicated event row, and relation lines connect the marker to the invocation that emitted the event and to the invocation created by the trigger run. Status, result, exception, cron, and event-triggered runs use distinct relation colors, so you can tell whether a task was called directly, started by an emitted event, or started by a condition on another task.
Timeline range zoom
The timeline toolbar exposes a magnifying-glass tool. Toggle it on, then drag across the SVG to draw a selection rectangle over the moment you want to inspect; releasing the pointer reloads the page scoped to the selected start_date / end_date at a finer resolution. Press Esc to cancel without zooming. Combine it with the time-range filter for fast drill-down from “last hour” to a sub-second incident.
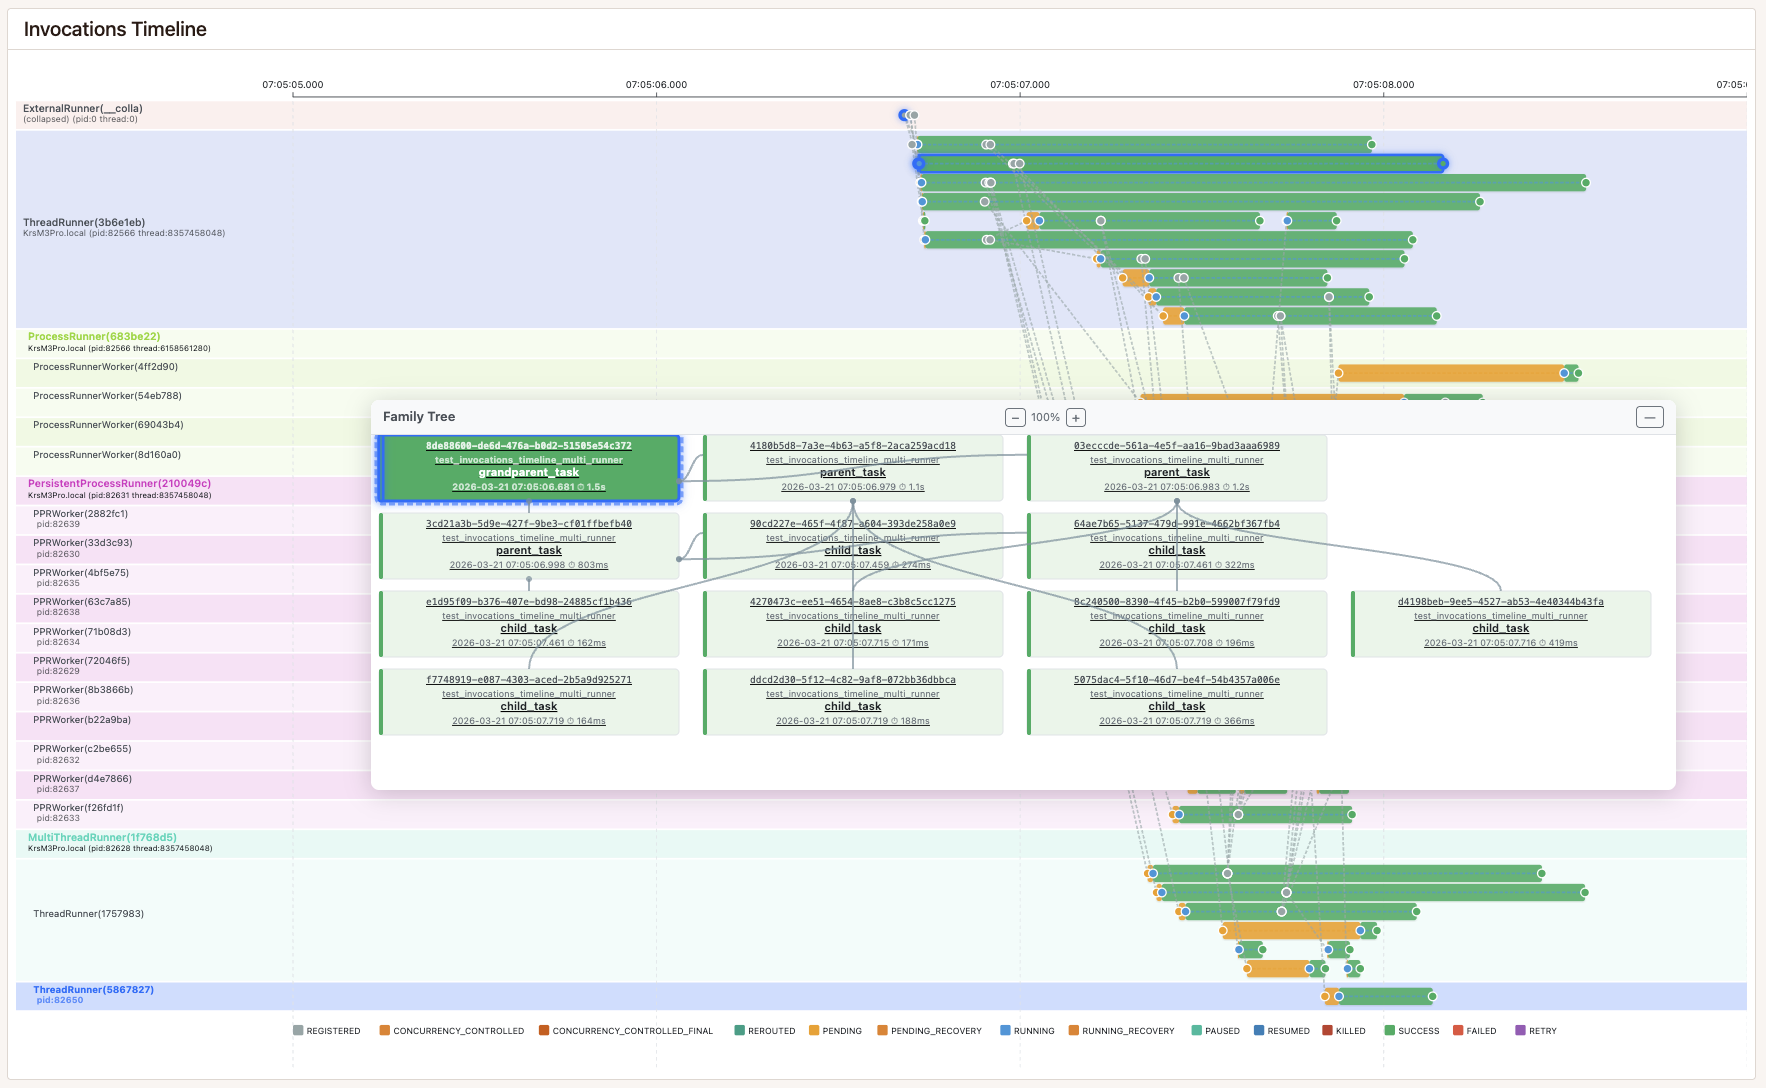
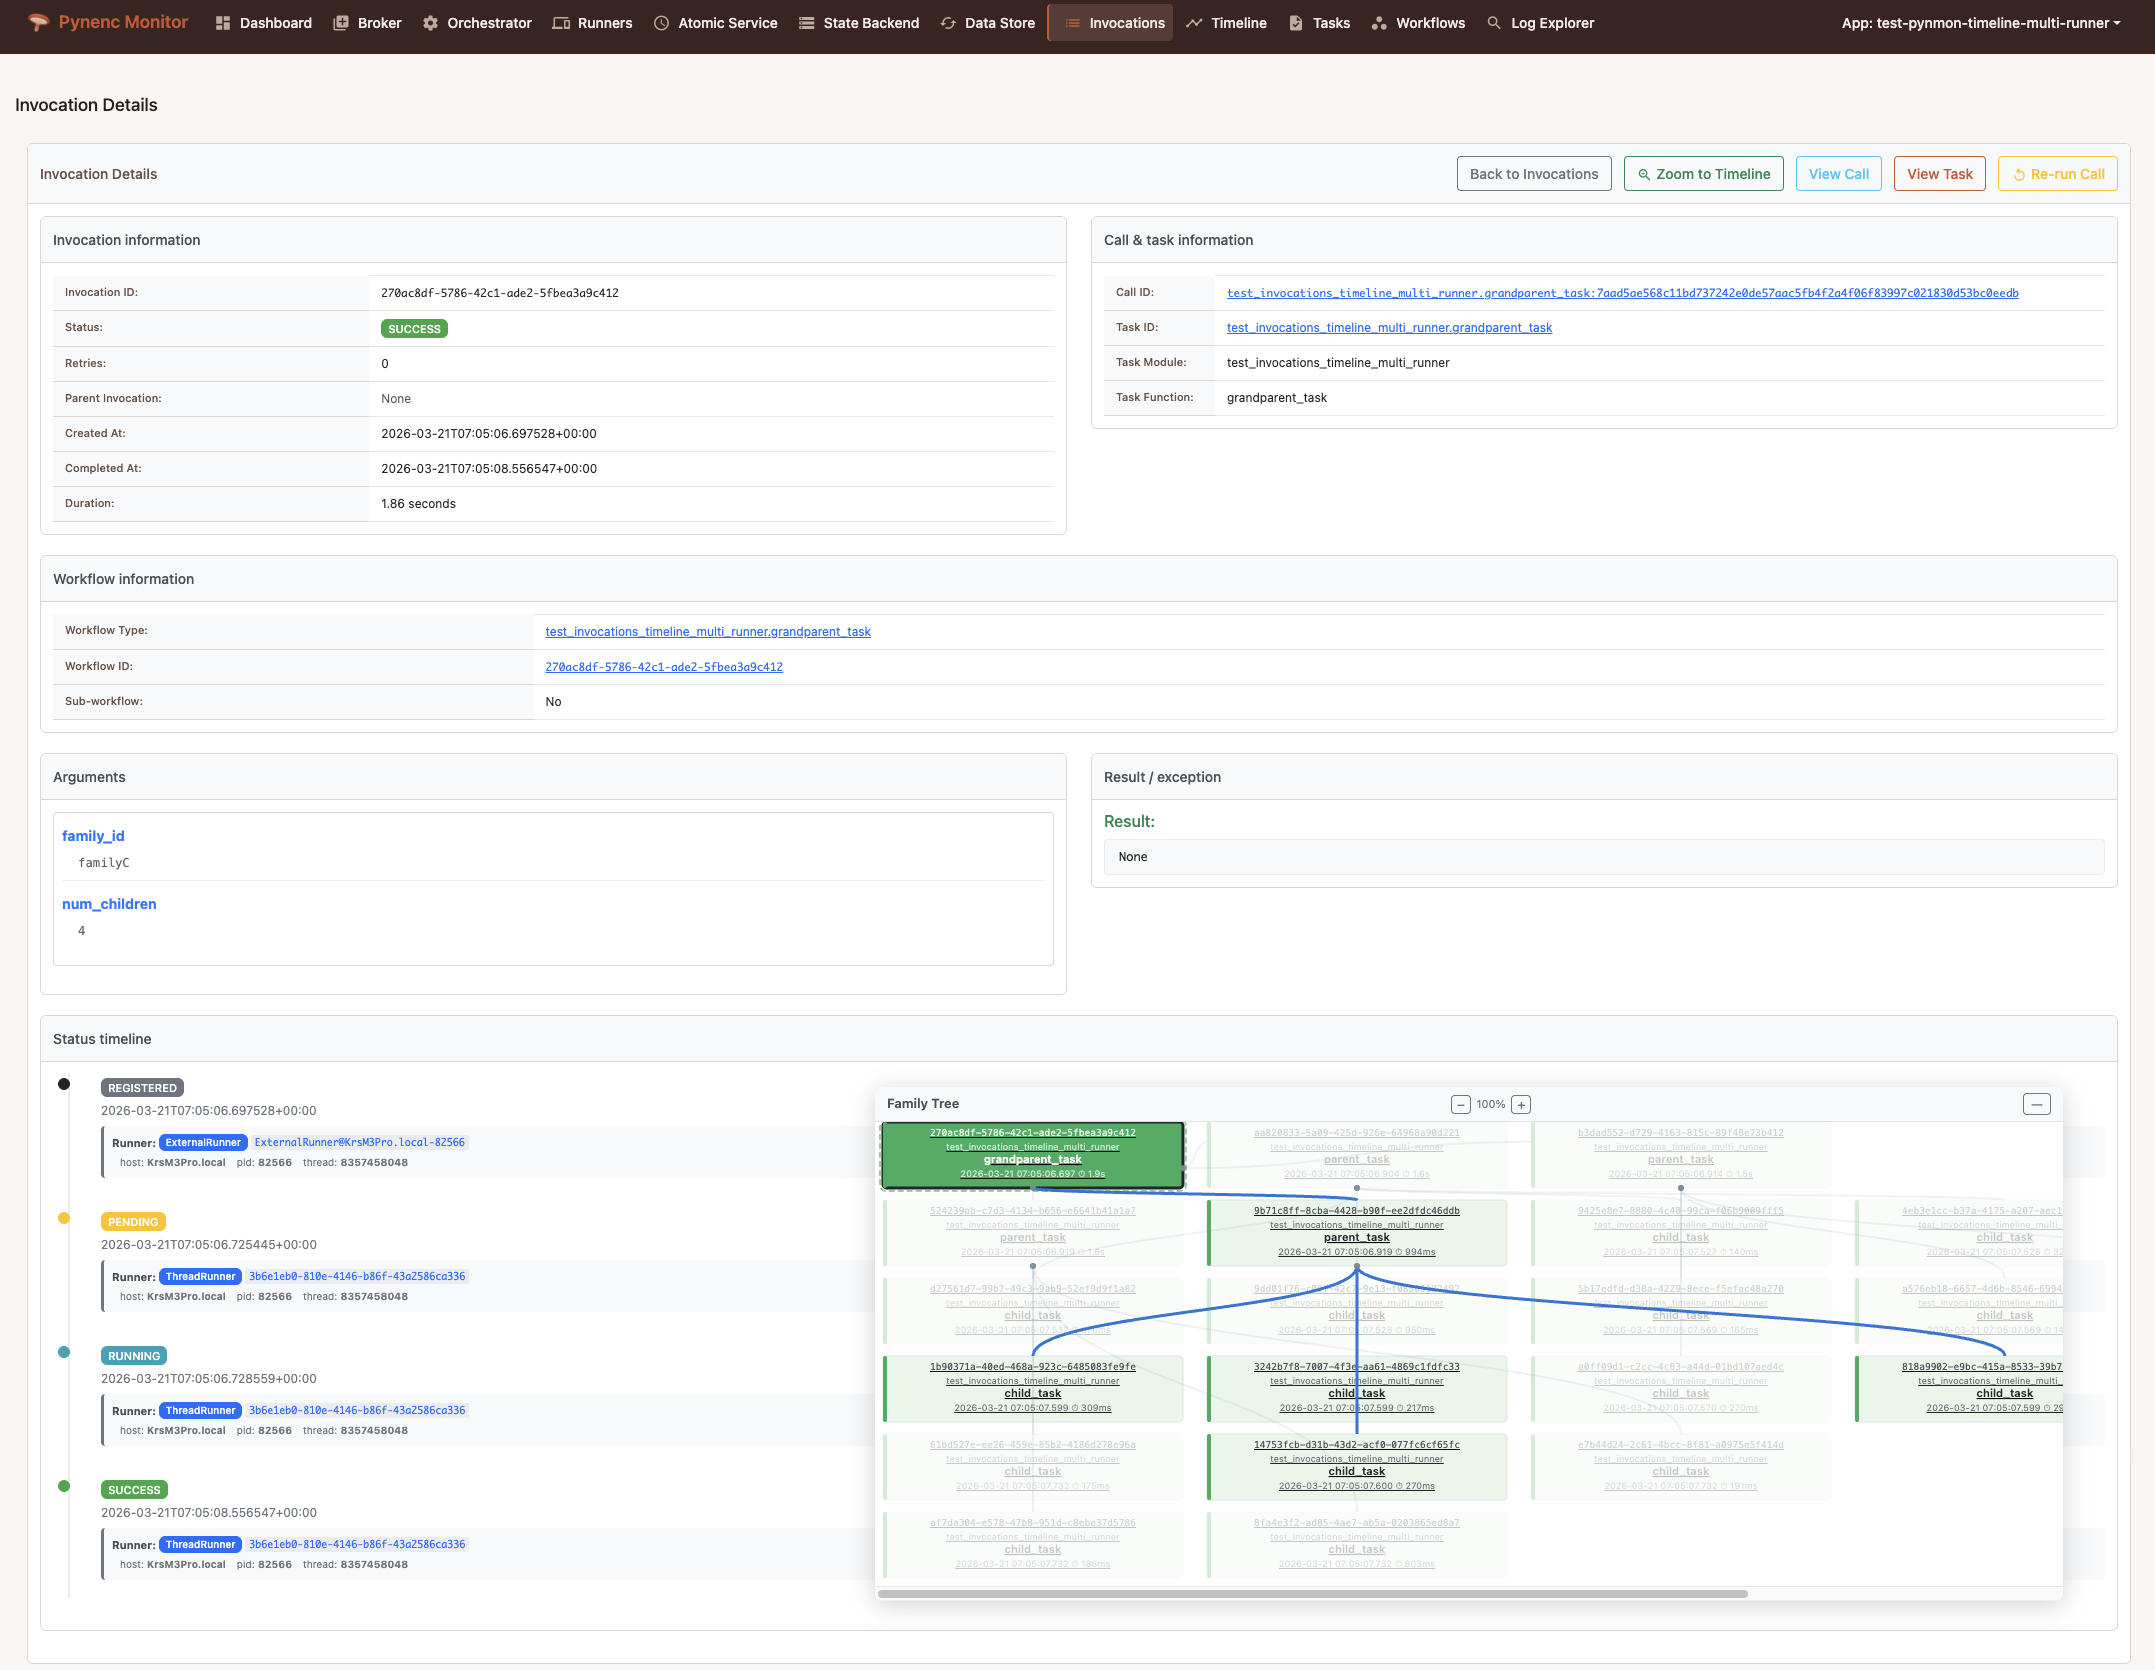
Family Tree
Navigate the full hierarchy of task calls as an interactive graph. When a grandparent task spawns parents that spawn children, the family tree displays the entire chain. Selecting a node cross-highlights it on the timeline, and vice versa — making it trivial to understand both the logical structure and the physical execution of complex workflows.
Invocation Details
Every invocation has a detail page showing its status, arguments, result or exception, workflow membership, full status history with timestamps, runner context, and the family tree. When the invocation was started by a trigger run, the detail page also shows the originating trigger run, the events the invocation emitted, and the downstream trigger runs those events produced — all in one place.
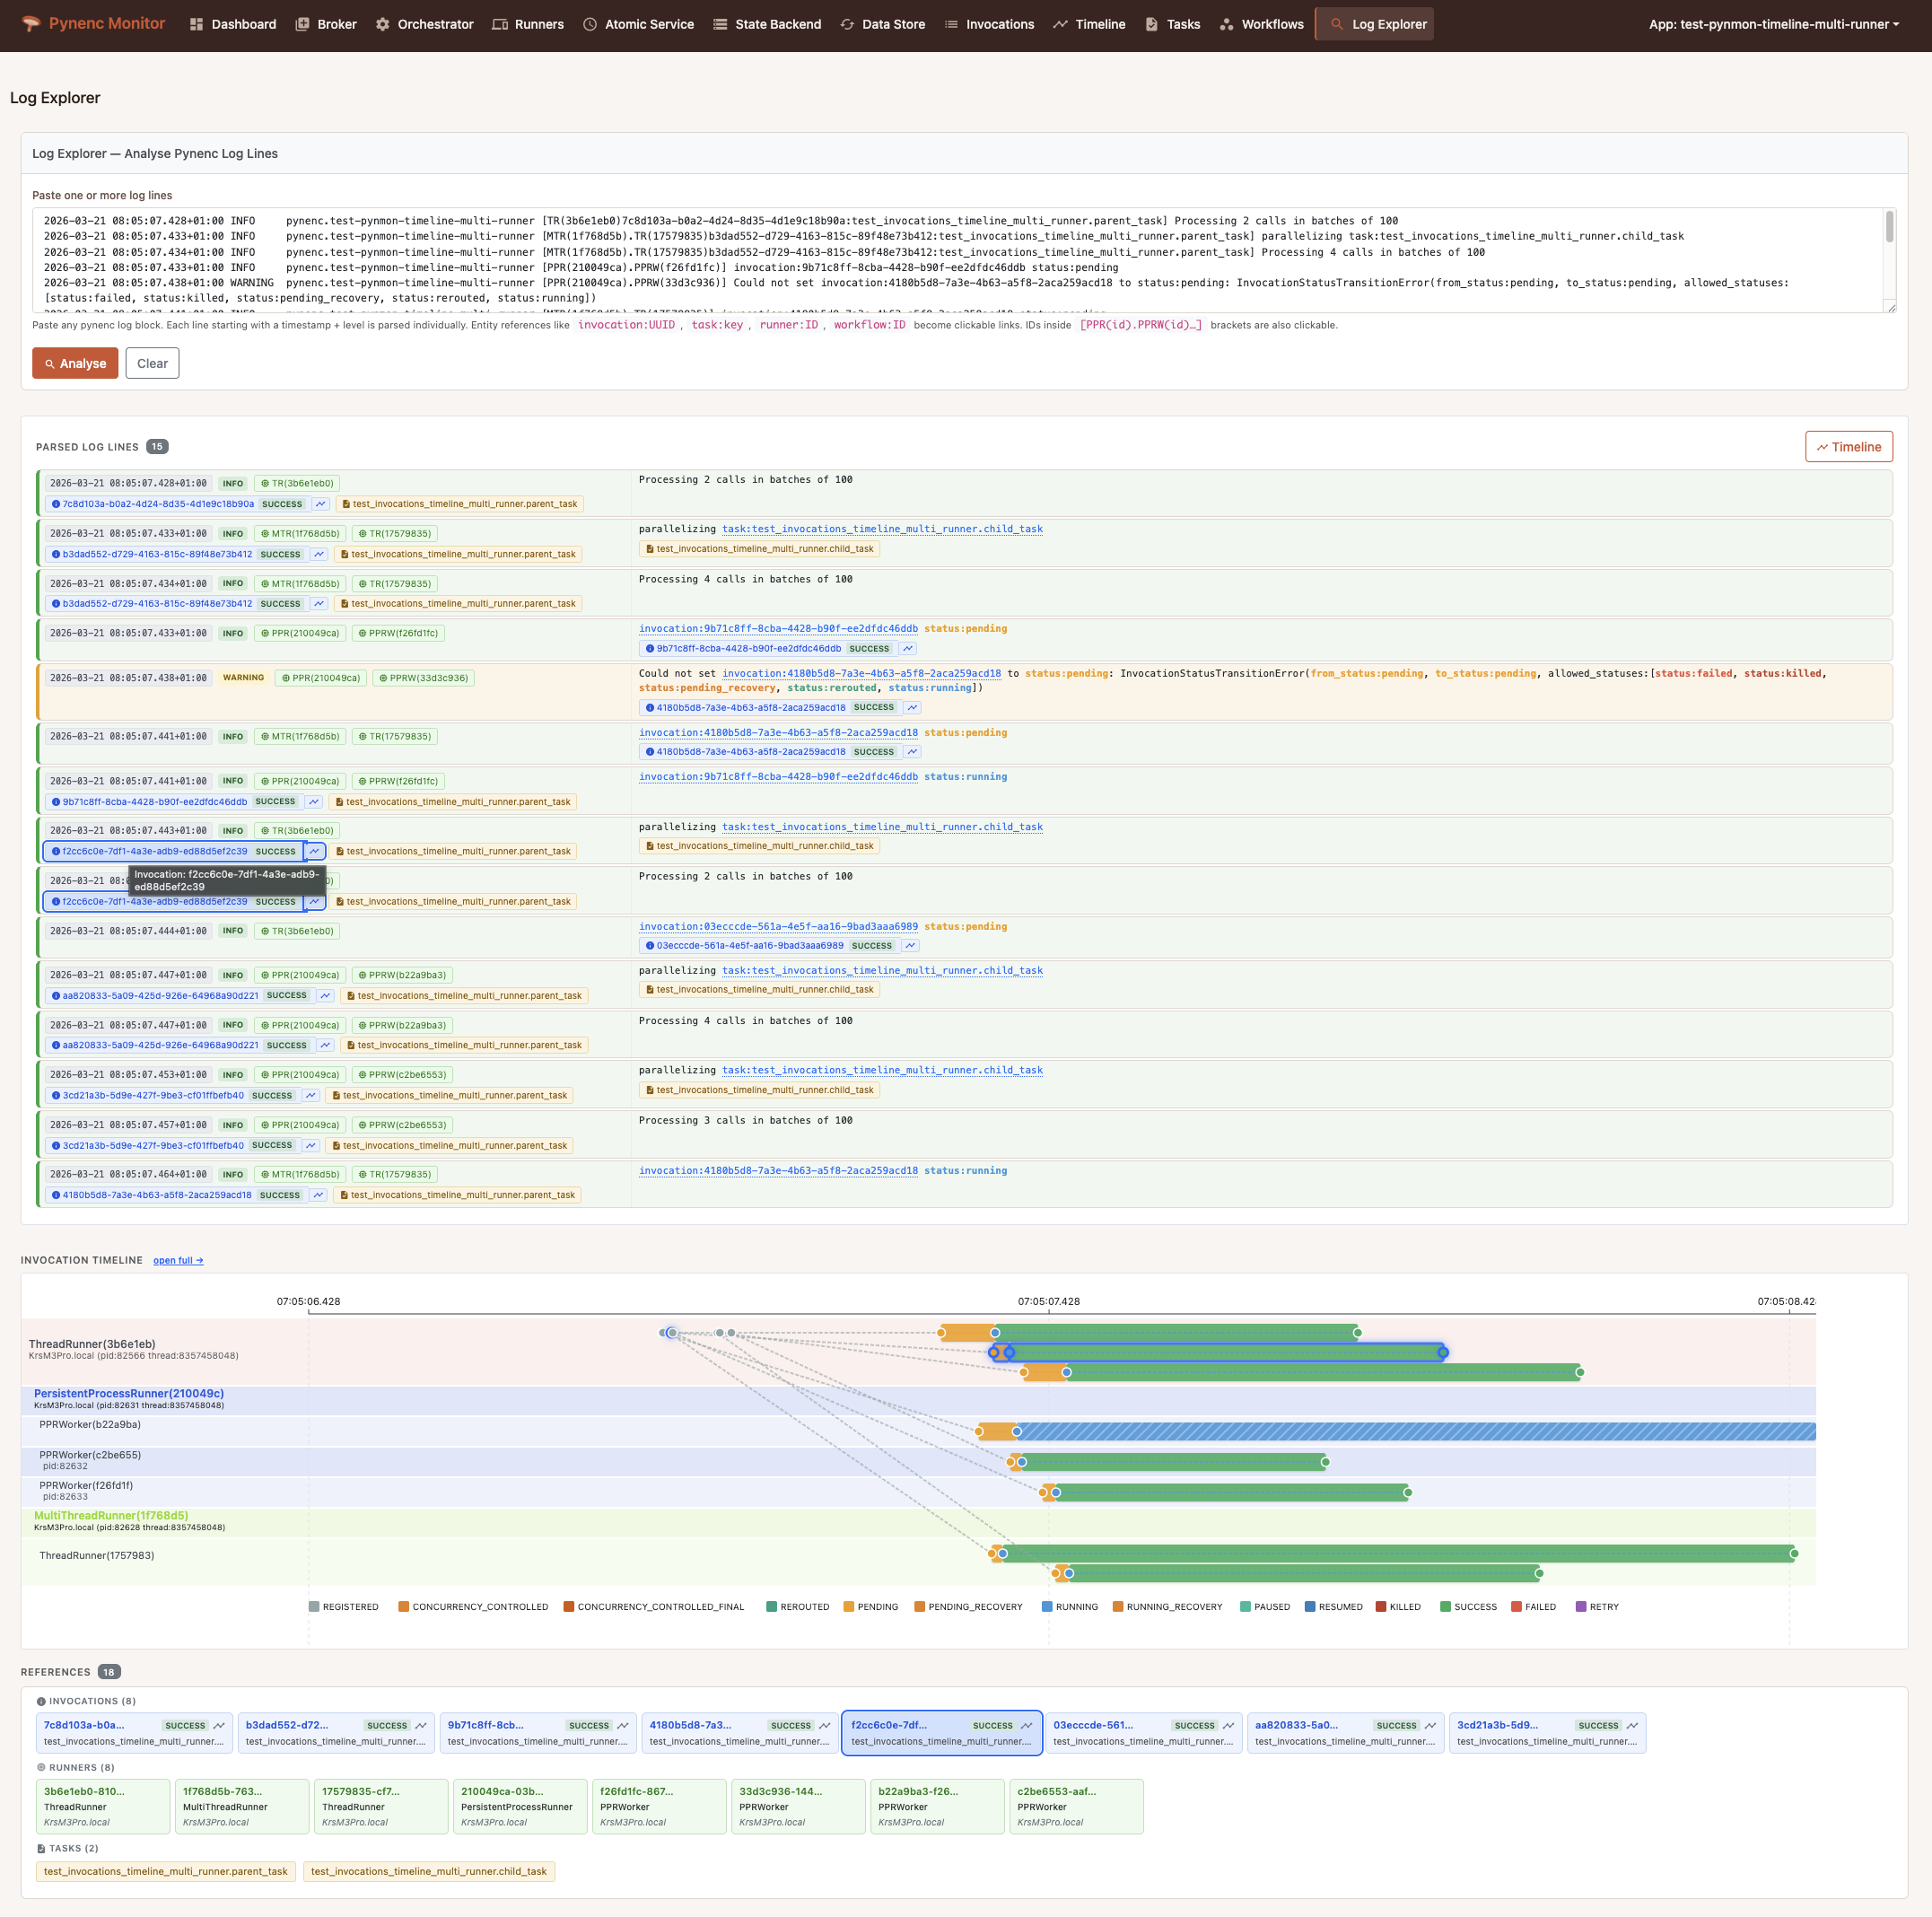
Log Explorer
Paste your Pynenc log lines and the Log Explorer augments them with full context. It parses runner contexts, invocation IDs, task references, event IDs, trigger-run IDs, conditions, and trigger IDs from the logs, resolving each to its detail page when one exists. It generates a mini-timeline of all invocations mentioned in the logs — including their parents and the invocations that emitted any referenced events — and highlights the matching SVG markers, bars, chips, runners, and workers. The “open full” link keeps the same time window in the main timeline, so you can move from a pasted log block to the full visual context without losing the zoom.
Trigger Events
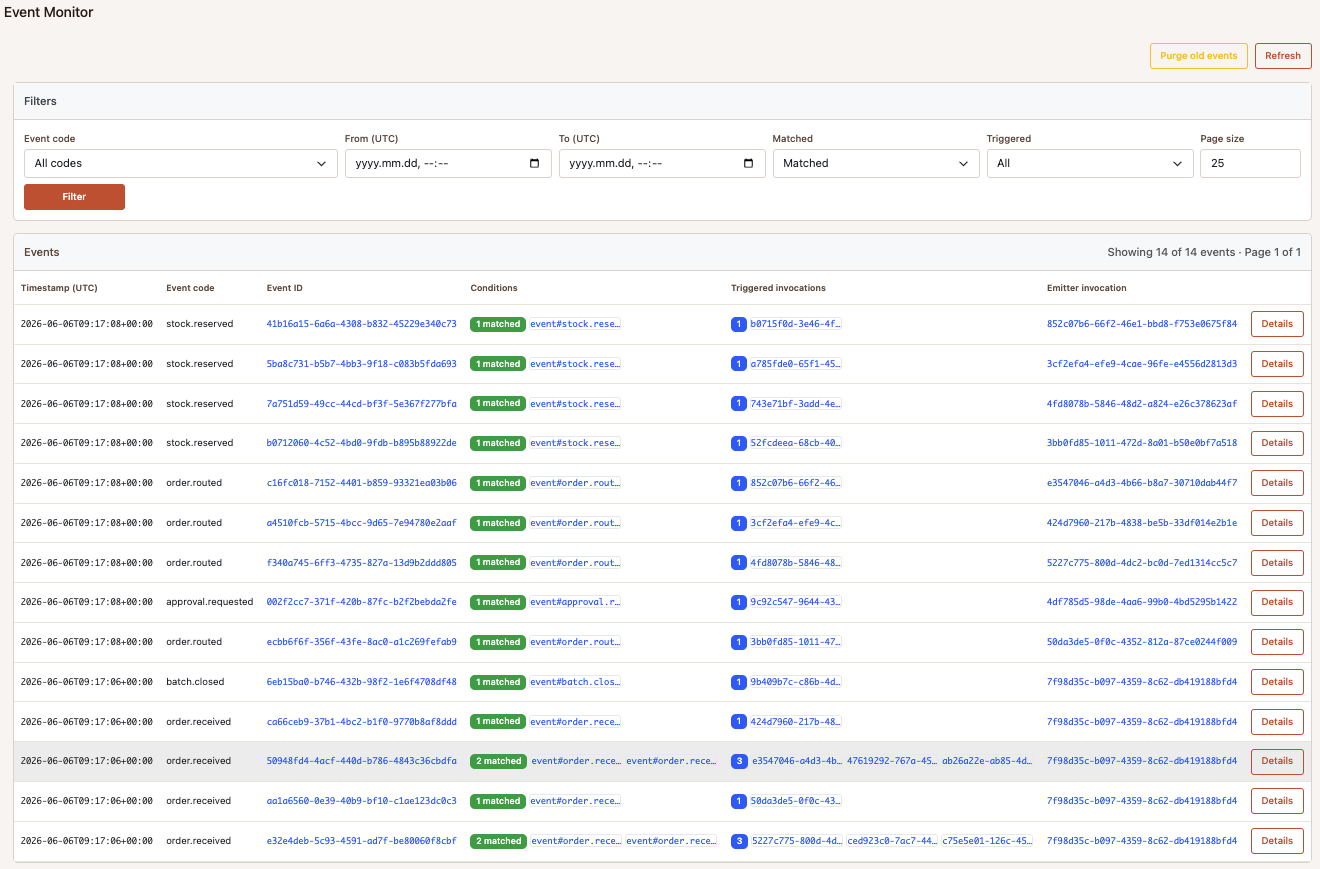
Every event published with app.trigger.emit_event(...) is stored as an EventRecord, even when no trigger condition matches it. The record keeps the event code, UTC timestamp, payload, emitter task and invocation when the event was emitted inside a task, and the valid and matched condition IDs. The trigger backend also indexes the trigger runs and generated invocations that reference the event. This makes the event store useful both for successful event-driven workflows and for debugging events that were recorded but did not trigger anything.
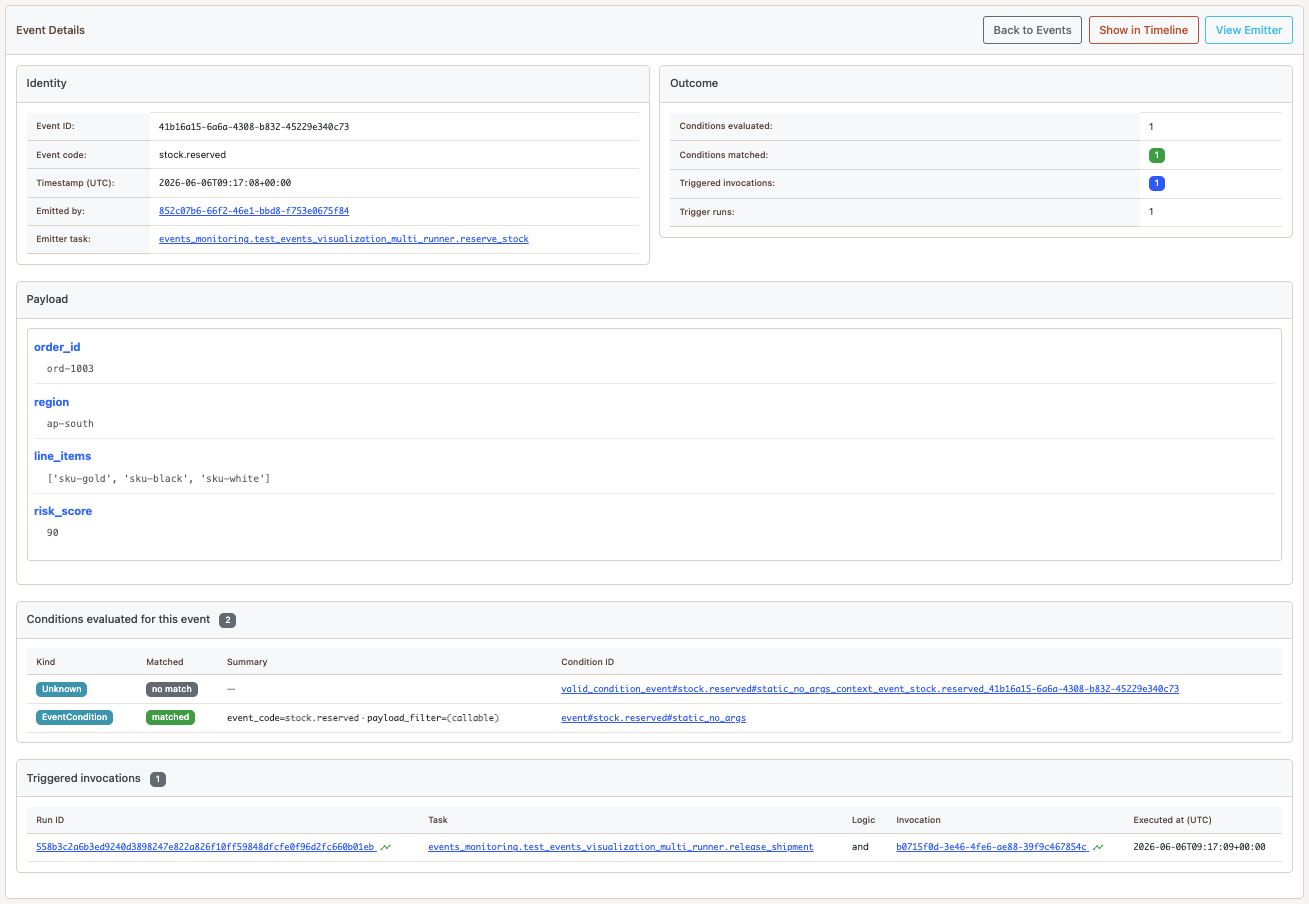
The /events view lists events with filters for event code, time range, matched outcome, and triggered outcome. From an event detail page you can inspect the payload, emitter, valid and matched conditions, trigger runs, and generated invocations. The “Show in Timeline” action opens the execution timeline focused on the relevant window and invocation scope, so the event, emitter, source invocations, trigger run, and triggered invocation appear together when that data exists.
Invocation detail pages show the same relations from the other direction: the trigger run that created the invocation, source events or source invocations that satisfied the trigger, events emitted by the invocation, and downstream trigger runs caused by those events. Trigger-run detail pages preserve the per-condition participant data, including condition type, context type, source event or invocation, context timestamp, and the generated invocation. This is especially useful for composite triggers, where you need to know which event/status/result/exception participant satisfied each part of the condition.
The main timeline shows triggered event markers by default for the selected time window. Event pages can focus the timeline on a specific event, and trigger-run pages can focus it on the source and generated invocation context for that run. Matched events that did not create invocations are still visible in the event monitor and can be opened directly; recorded-only events remain auditable without adding noise to the default timeline. Storage is bounded by configurable retention and capacity (event_retention_days, event_max_records, trigger_run_max_records, event_auto_purge_enabled).
This gives you a few direct investigation paths:
Did this event arrive? Filter
/eventsby event code and time range, then check whether it was recorded, matched, or triggered.Why did this invocation start? Open the invocation detail page and follow the trigger origin back to the source event, source invocation, condition, and trigger run.
What did this event cause? Open the event detail page to see the trigger runs and generated invocations, or open the focused timeline view to inspect their timing.
Which task emitted this event? Use the event detail page’s emitter link, or use the timeline relation from the event marker back to the emitter invocation.
What happened around this log line? Paste the line into the Log Explorer; event and trigger-run references resolve to the same detail pages and mini-timeline context.
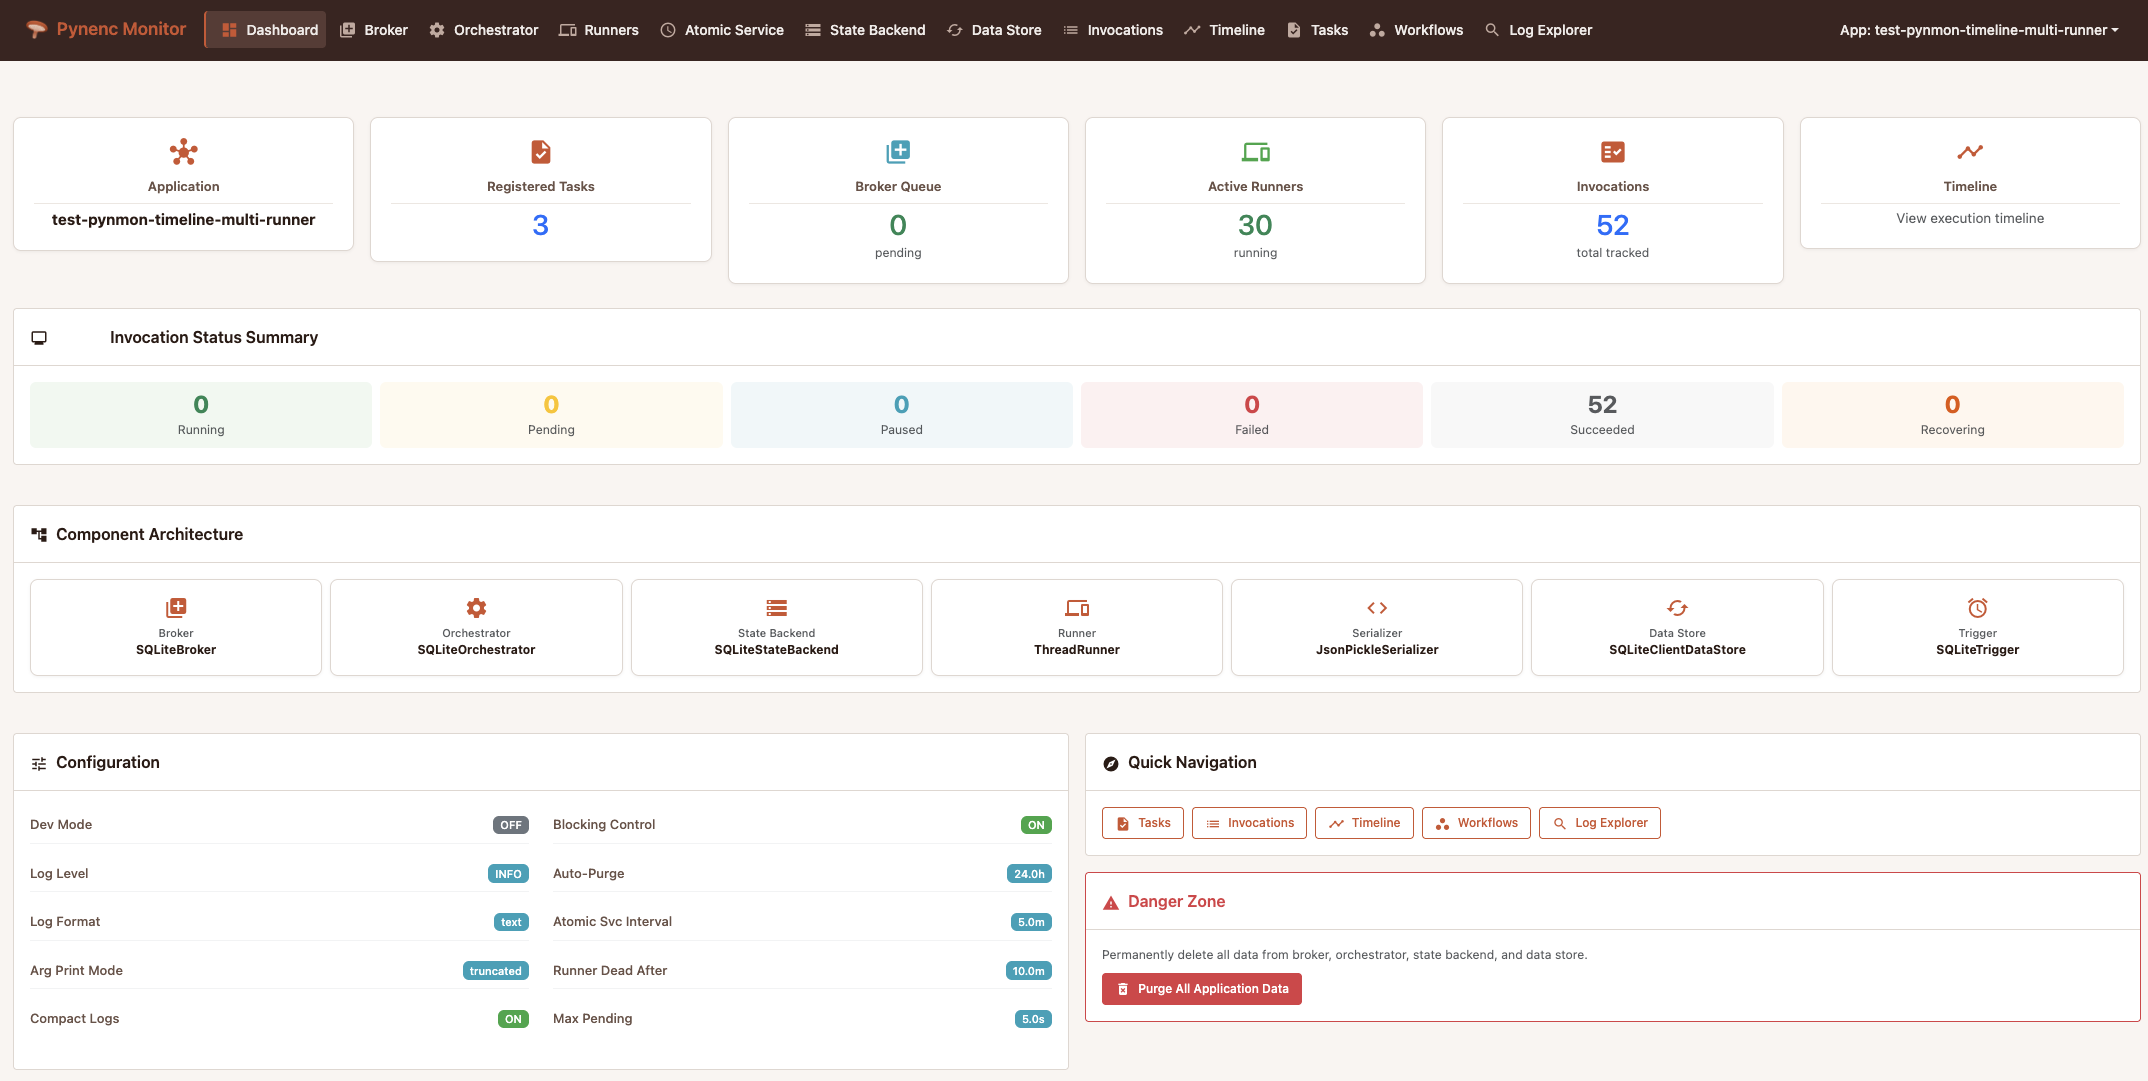
Overview
Pynmon provides real-time visibility into your distributed task execution through a web interface built with FastAPI, Jinja2, and HTMX. It connects to the same backends as your Pynenc application and displays live data about tasks, invocations, runners, and workflows.
Installation
pip install pynenc[monitor]
Requires Python < 3.13 (FastAPI/Pydantic v2 dependency constraint).
Starting the Monitor
# Auto-discover registered apps
pynenc monitor

# With a specific app
pynenc --app myapp.tasks.app monitor --host 0.0.0.0 --port 8000

# With debug logging
pynenc monitor --log-level debug
Option |
Default |
Description |
|---|---|---|
|
|
Server bind address |
|
|
Server bind port |
|
|
Logging verbosity |
For a full list of HTTP endpoints, see Pynmon API Reference.